CITE: The Collaborative Interactive Table for Education

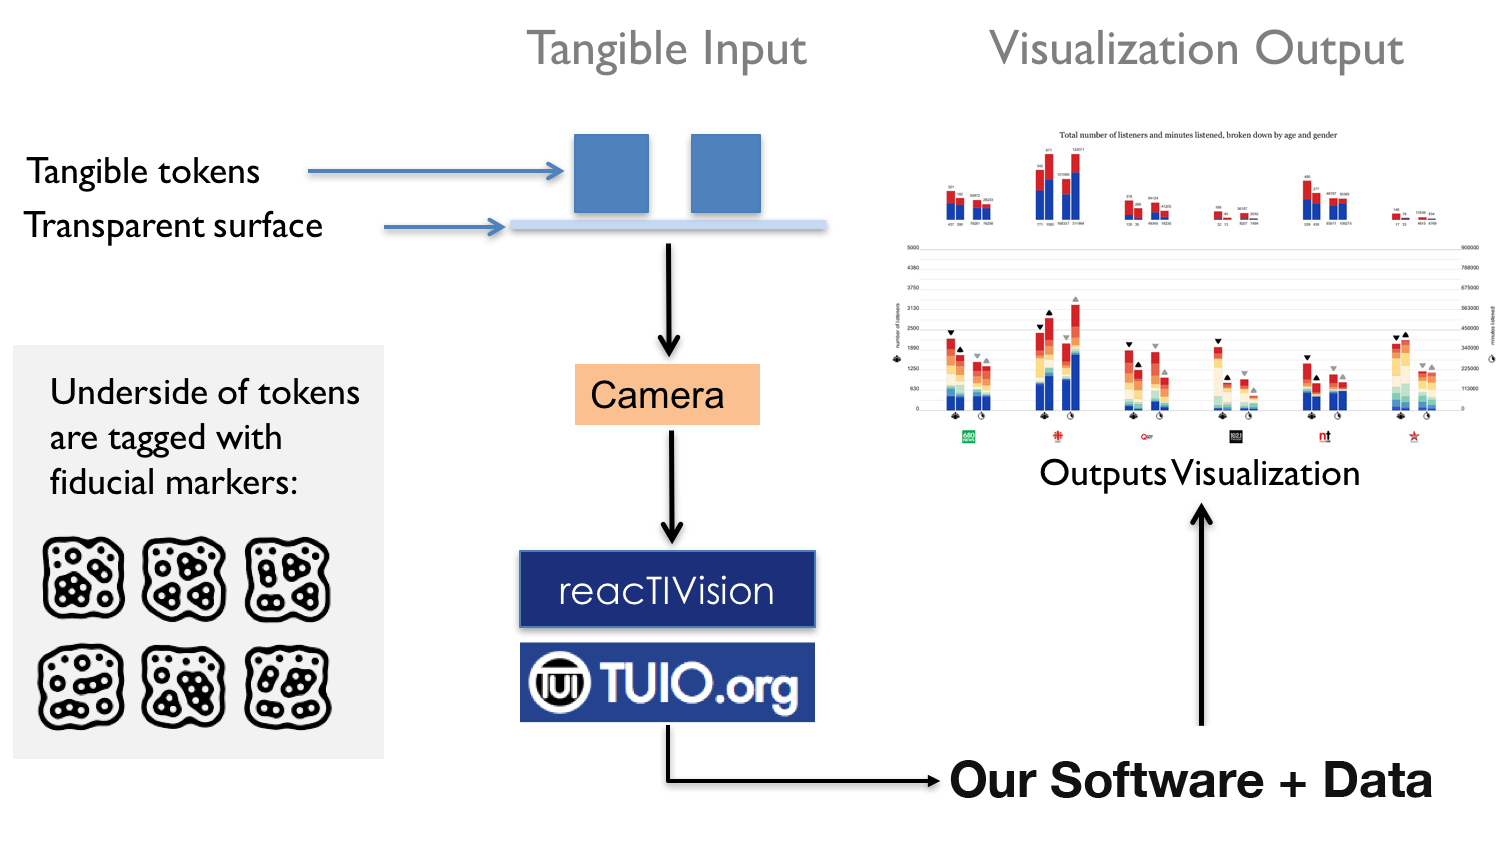
The Collaborative Interactive Tabletop for Education (CITE) allows users to manipulate on-screen data visualizations through the manipulation of hand-held tabletop objects, as illustrated in the diagram above. The system includes sound and touch features that considers users with visual impairments.
Research has shown that interacting with tangible user interfaces (TUI), such as CITE, enhances collaborative behavior, strengthens learning, and improves user experience. While many TUI rely on specialized hardware, our approach is to create a system, a set of verified instructions along with software packages, for adapting standard computer hardware into a highly customizable tangible interactive tabletop.
This work builds on the datablocks project, shown in the video below, which was developed in 2016 by the principal investigator. CITE features new visualizations, new software that is robust and amenable to user edits, digitally modeled tokens, and design considerations for the visually impaired.
This website is intended to provide the resources you need (instructions and software) to build CITE yourself. Please feel free to contact the team members with any questions.
How it Works
The tokens are tracked by means of a camera placed beneath a transparent tabletop. The bottom of each object is marked with a fiducial marker specially designed to be identified by the (open-source) reacTIVision software, and the camera placed below the table captures the image of the fiducial markers in real time. The reacTIVision software outputs the ID of each identified marker and its X and Y coordinates, when they are in the field of view of the camera. This information is interpreted by the TUIO protocol and processed by our software, which constructs the visualizations from a database filtered by the user’s query.
The illustration below provides a schematic of the system.
Our Prototype
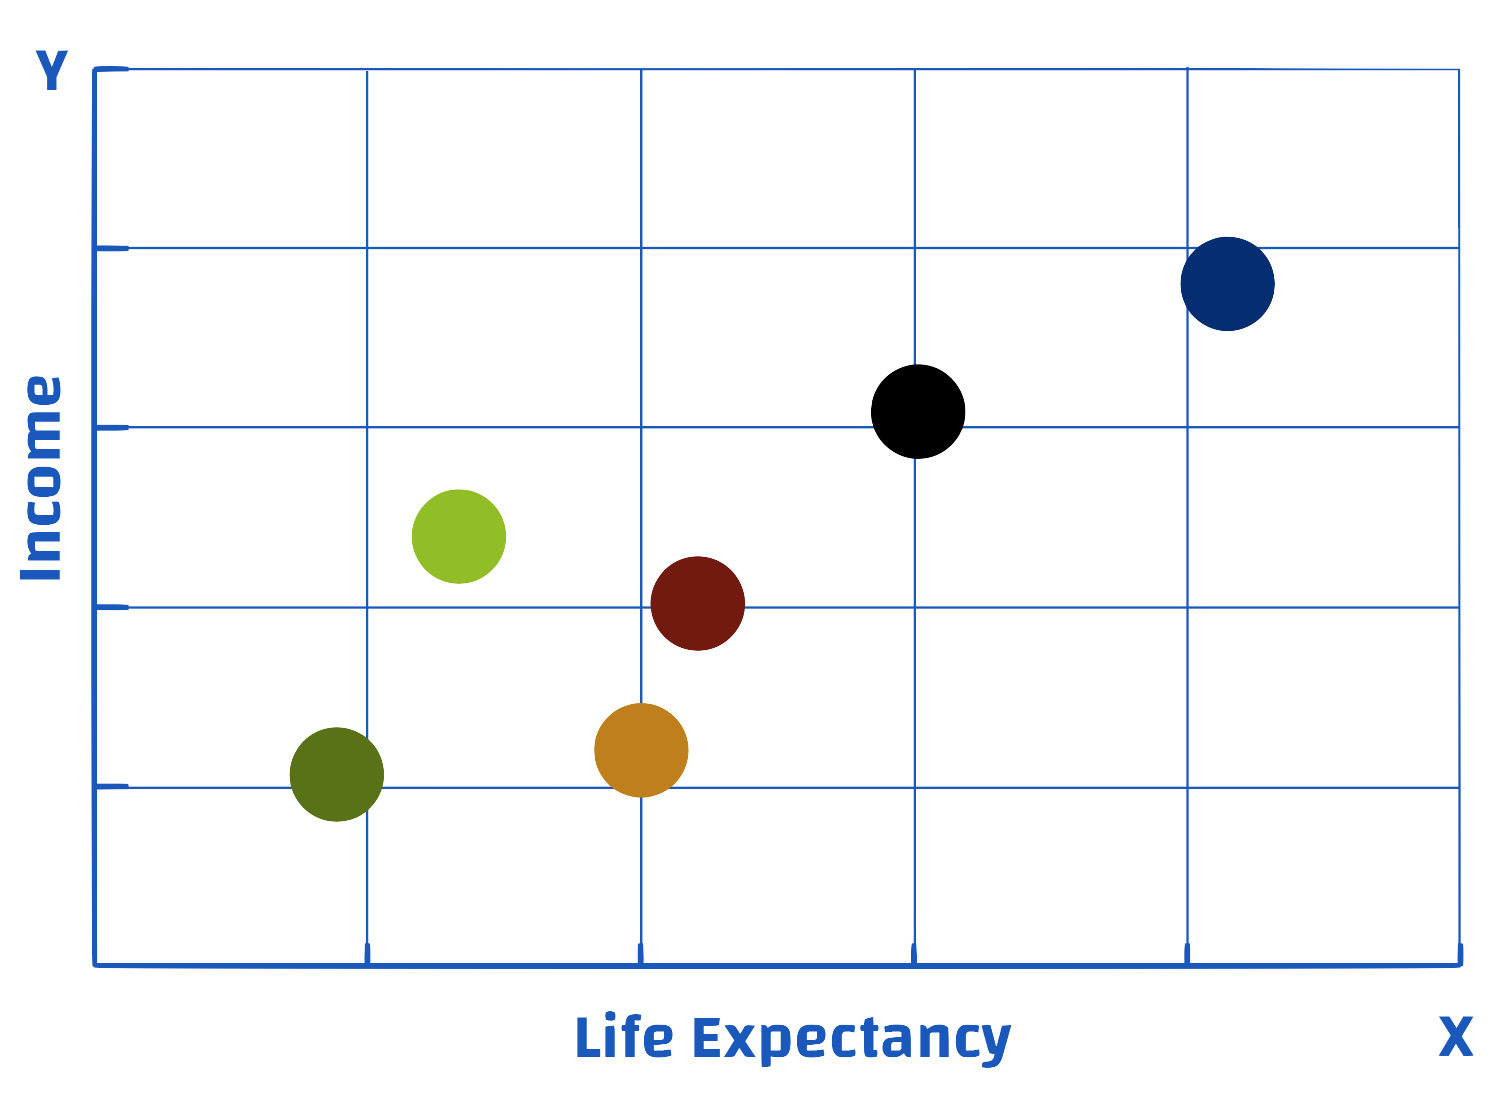
Our prototype, for which we provide instructions and software here, uses data from Gapminder, and displays visualizations, similar to the one illustrated below, that are inspired by gapminder's bubble scatter plots. Users interact with the graph by manipulating tokens on the table.
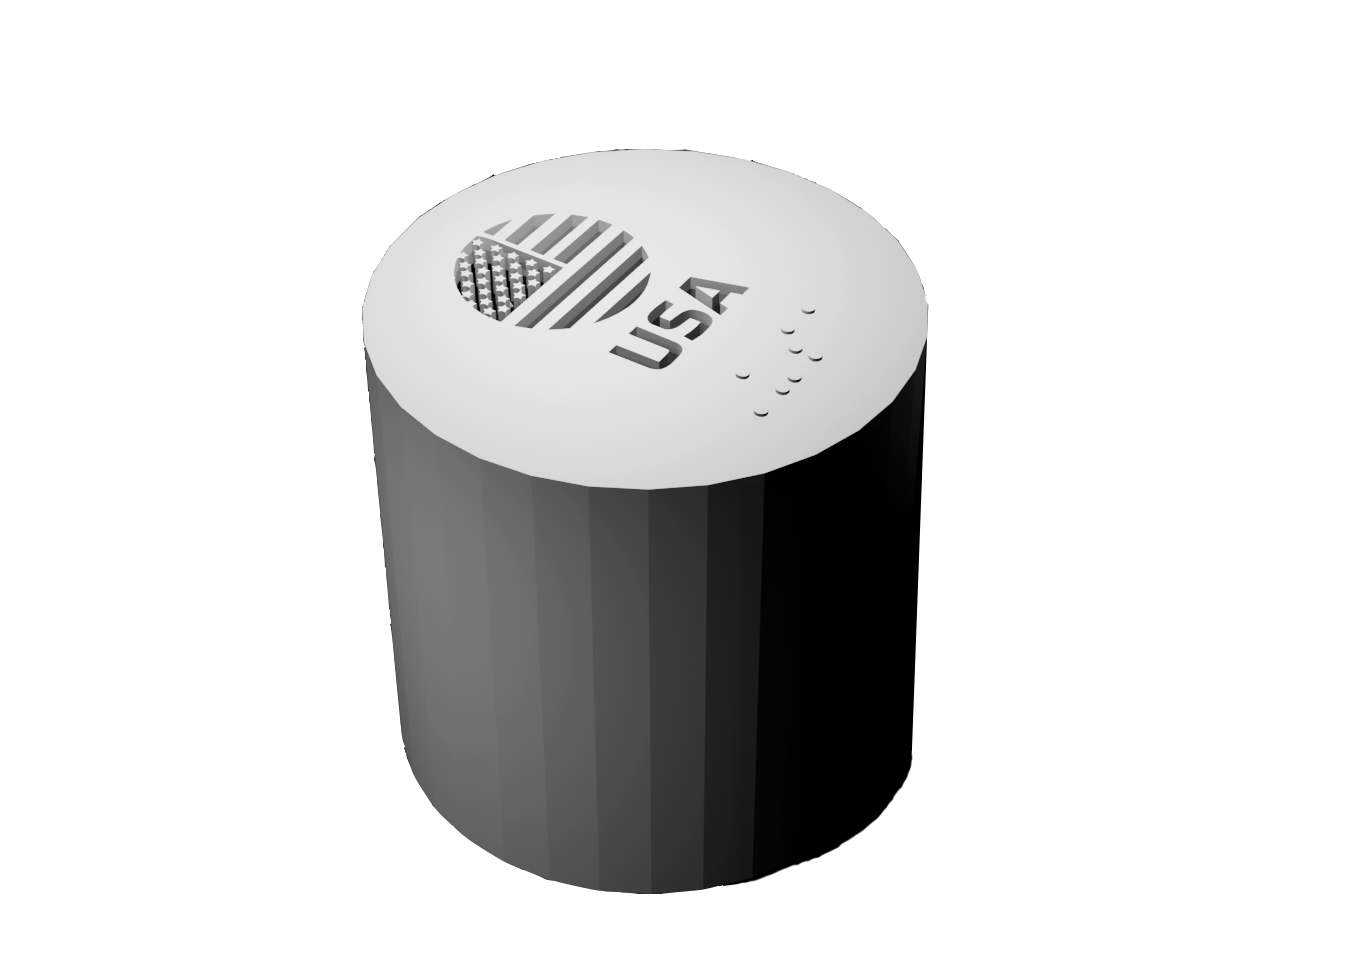
To add or remove countries from the scatter plot, users add or remove the corresponding 'country' token from the table. Our prototype allows users to view data from up to six countries: United States, Brazil, Greece, Australia, Singapore, and Kenya. Below is an illustration of one of our country tokens.
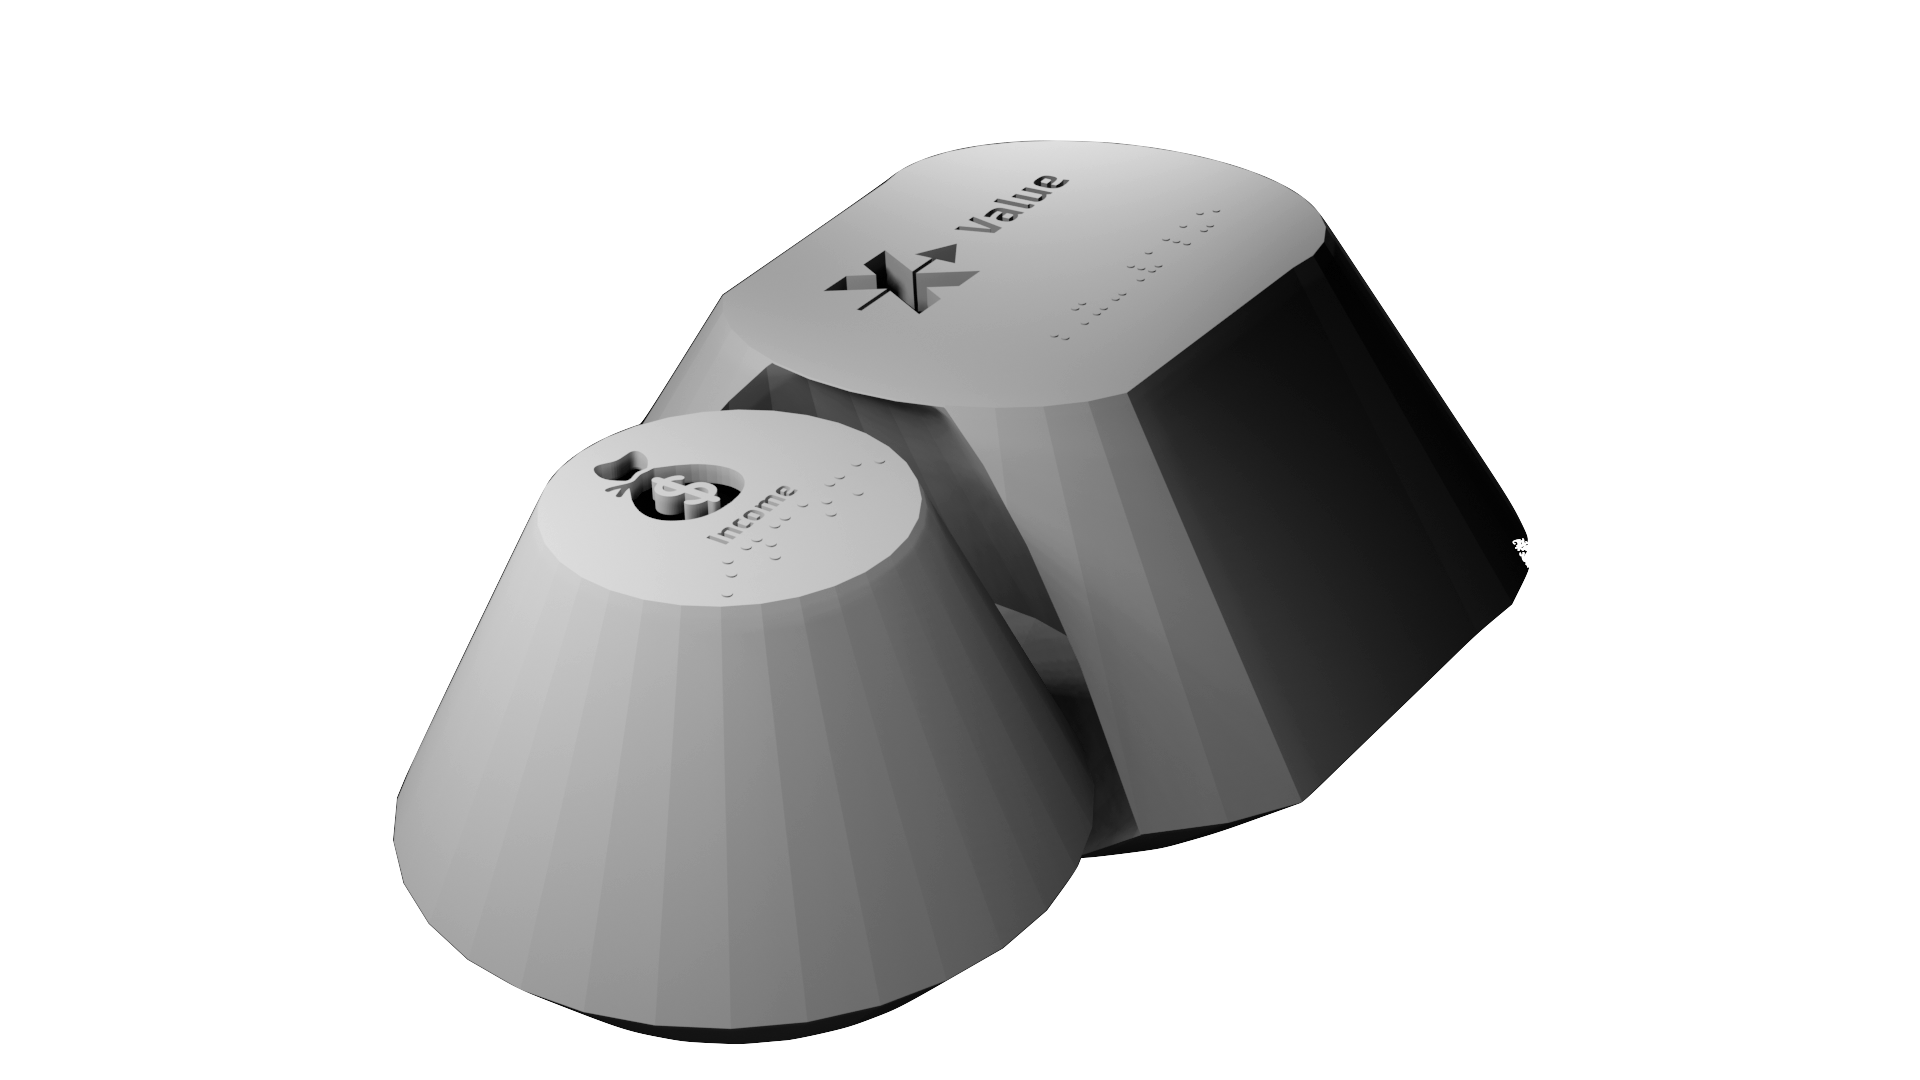
Users can select from the following list of indicators to plot on the x or y axis: Life Expectancy, Income, CO2 Emissions, Child Mortality, Pump Price for Gasoline, or Population Density. To plot Income on the x-axis, for example, users place the Income token within the slot of the x-value token, as illustrated below.
Our current prototype displays data for 2002, but our software can be modified easily to show data from another year or allow users to select the year with a token interaction.
We note that there is also a sound component to accompany the visual display to help guide users that may be visually impaired. The software announces each token as it is placed on (or removed from) the table, and narrates the information displayed on the graph.
Our Team
This work was done at SUNY Polytechnic Institute, and funded by an Innovative Instruction Technology Grant (IITG).

Team members:
Ana Jofre, Principal Investigator
Kristina Boylan, Co-Investigator
Nick LeJeune, Co-Investigator
Michael Reale, Co-Investigator
Ibrahim Yucel, Co-Investigator
Josh Rosenbaum, Student Researcher
Kyle Frenette, Student Researcher
Nicholas Byard, Student Researcher
John Harlan, Student Researcher
Instructions and downloads for building the table
Here we provide instructions and recommendations for replicating our prototype, and we encourage you to add your own modifications as needs or restrictions arise.
We divide the instructions here into 3 steps: Building the table, installing the software, and creating the tokens.
Build the Table

To build this system, you will need a table with a transparent top and a camera mounted below. We recommend the design illustrated above, where the camera is centered on the lower cross-bar. The camera position and zoom should be adjusted so that its full field-of-view encompasses the whole table surface. Our table was constructed using the following parts.
- Plexiglass surface (recommended model here)
- Webcam (recommended model here)
- Aluminum posts (recommended model here)
- Corner brackets & bolts (recommended model here)
The full parts list can be found on Amazon here.
A note on lighting
ReacTIVision software requires the right lighting conditions to recognize the token markers on the table. If you are 3-d printing the tokens, you can use an opaque translucent material and place an led light within the token. Otherwise, you will need to add some lighting from below. In doing so, you must be careful to avoid specular reflections from the glass as these will interfere with ReacTIVision's ability to see the tokens. Therefore, lights below the table should be pointed toward the floor, and we recommend that you check the camera to ensure there are no bright spots on the table surface.
Download the Software
Before downloading our software, we recommend that you download ReacTIVision and familiarize yourself with it.
Print out a few of the fiducial markers, place them on the table and make sure that ReacTIVision is able to recognize them. When recognized, a green cross along with the id number will appear on the marker, as illustrated below. We recommend doing this everytime you use the table, to ensure the lighting is right and that the markers are being detected.

Our software is available for download on github at this link. You will need Python 3.7 with Virtualenv and Anaconda or Miniconda for installation. The required Python libraries are Kivy, oscpy, pandas, matplotlib, playsound, gTTS (Google Text-to-Speech), and pyserial.
Users can modify the data displayed and the fiducial marker allocation without having to modify the code. The data is read into the software from csv files, and the fiducial marker allocation is input through json files. In our current prototype, as is, the fiducial marker IDs are allocated as follows:
- 0 - X Bucket
- 1 - Y Bucket
- 2 - Time Marker
- 11 - Indicator / Income
- 12 - Indicator / Life Expectancy
- 13 - Indicator / CO2 Emissions
- 14 - Indicator / Child Mortality
- 15 - Indicator / Pump Price for Gasoline
- 16 - Indicator / Population Density
- 21 - Country / United States
- 22 - Country / Brazil
- 23 - Country / Greece
- 24 - Country / Australia
- 25 - Country / Singapore
- 26 - Country / Kenya
Upon starting the software, if there are no markers on the table, the user will be prompted to start placing markers on the table.

The Indicator markers work in conjunction with the X and Y Buckets. For example, to plot Income on the x-axis and Life Expectancy on the y-axis, the user must place the Income marker in close proximity to the X Bucket marker, and the Life Expectancy marker in close proximity to the Y Bucket marker.

The user can now start placing Country tokens anywhere on the table to start viewing the data.

Our software includes sound to help the visually impaired. Each of the instructions are dictated, the graph is textually described, and the software announces which token has been placed or removed from the table in real-time.
Make the tokens
Here we provide the labels and 3d models for the tokens used the in our prototype. We provide two alternatives on building the tokens:
- Make your own token object, and attach our labels to the top and the corresponding fiducial to the bottom.
- Download our stl files and 3d-print the tokens. Our models include the label and corresponding fiducial embossed within the token.
Our labels
Our label designs each include braille and universal symbols, as illustrated below.
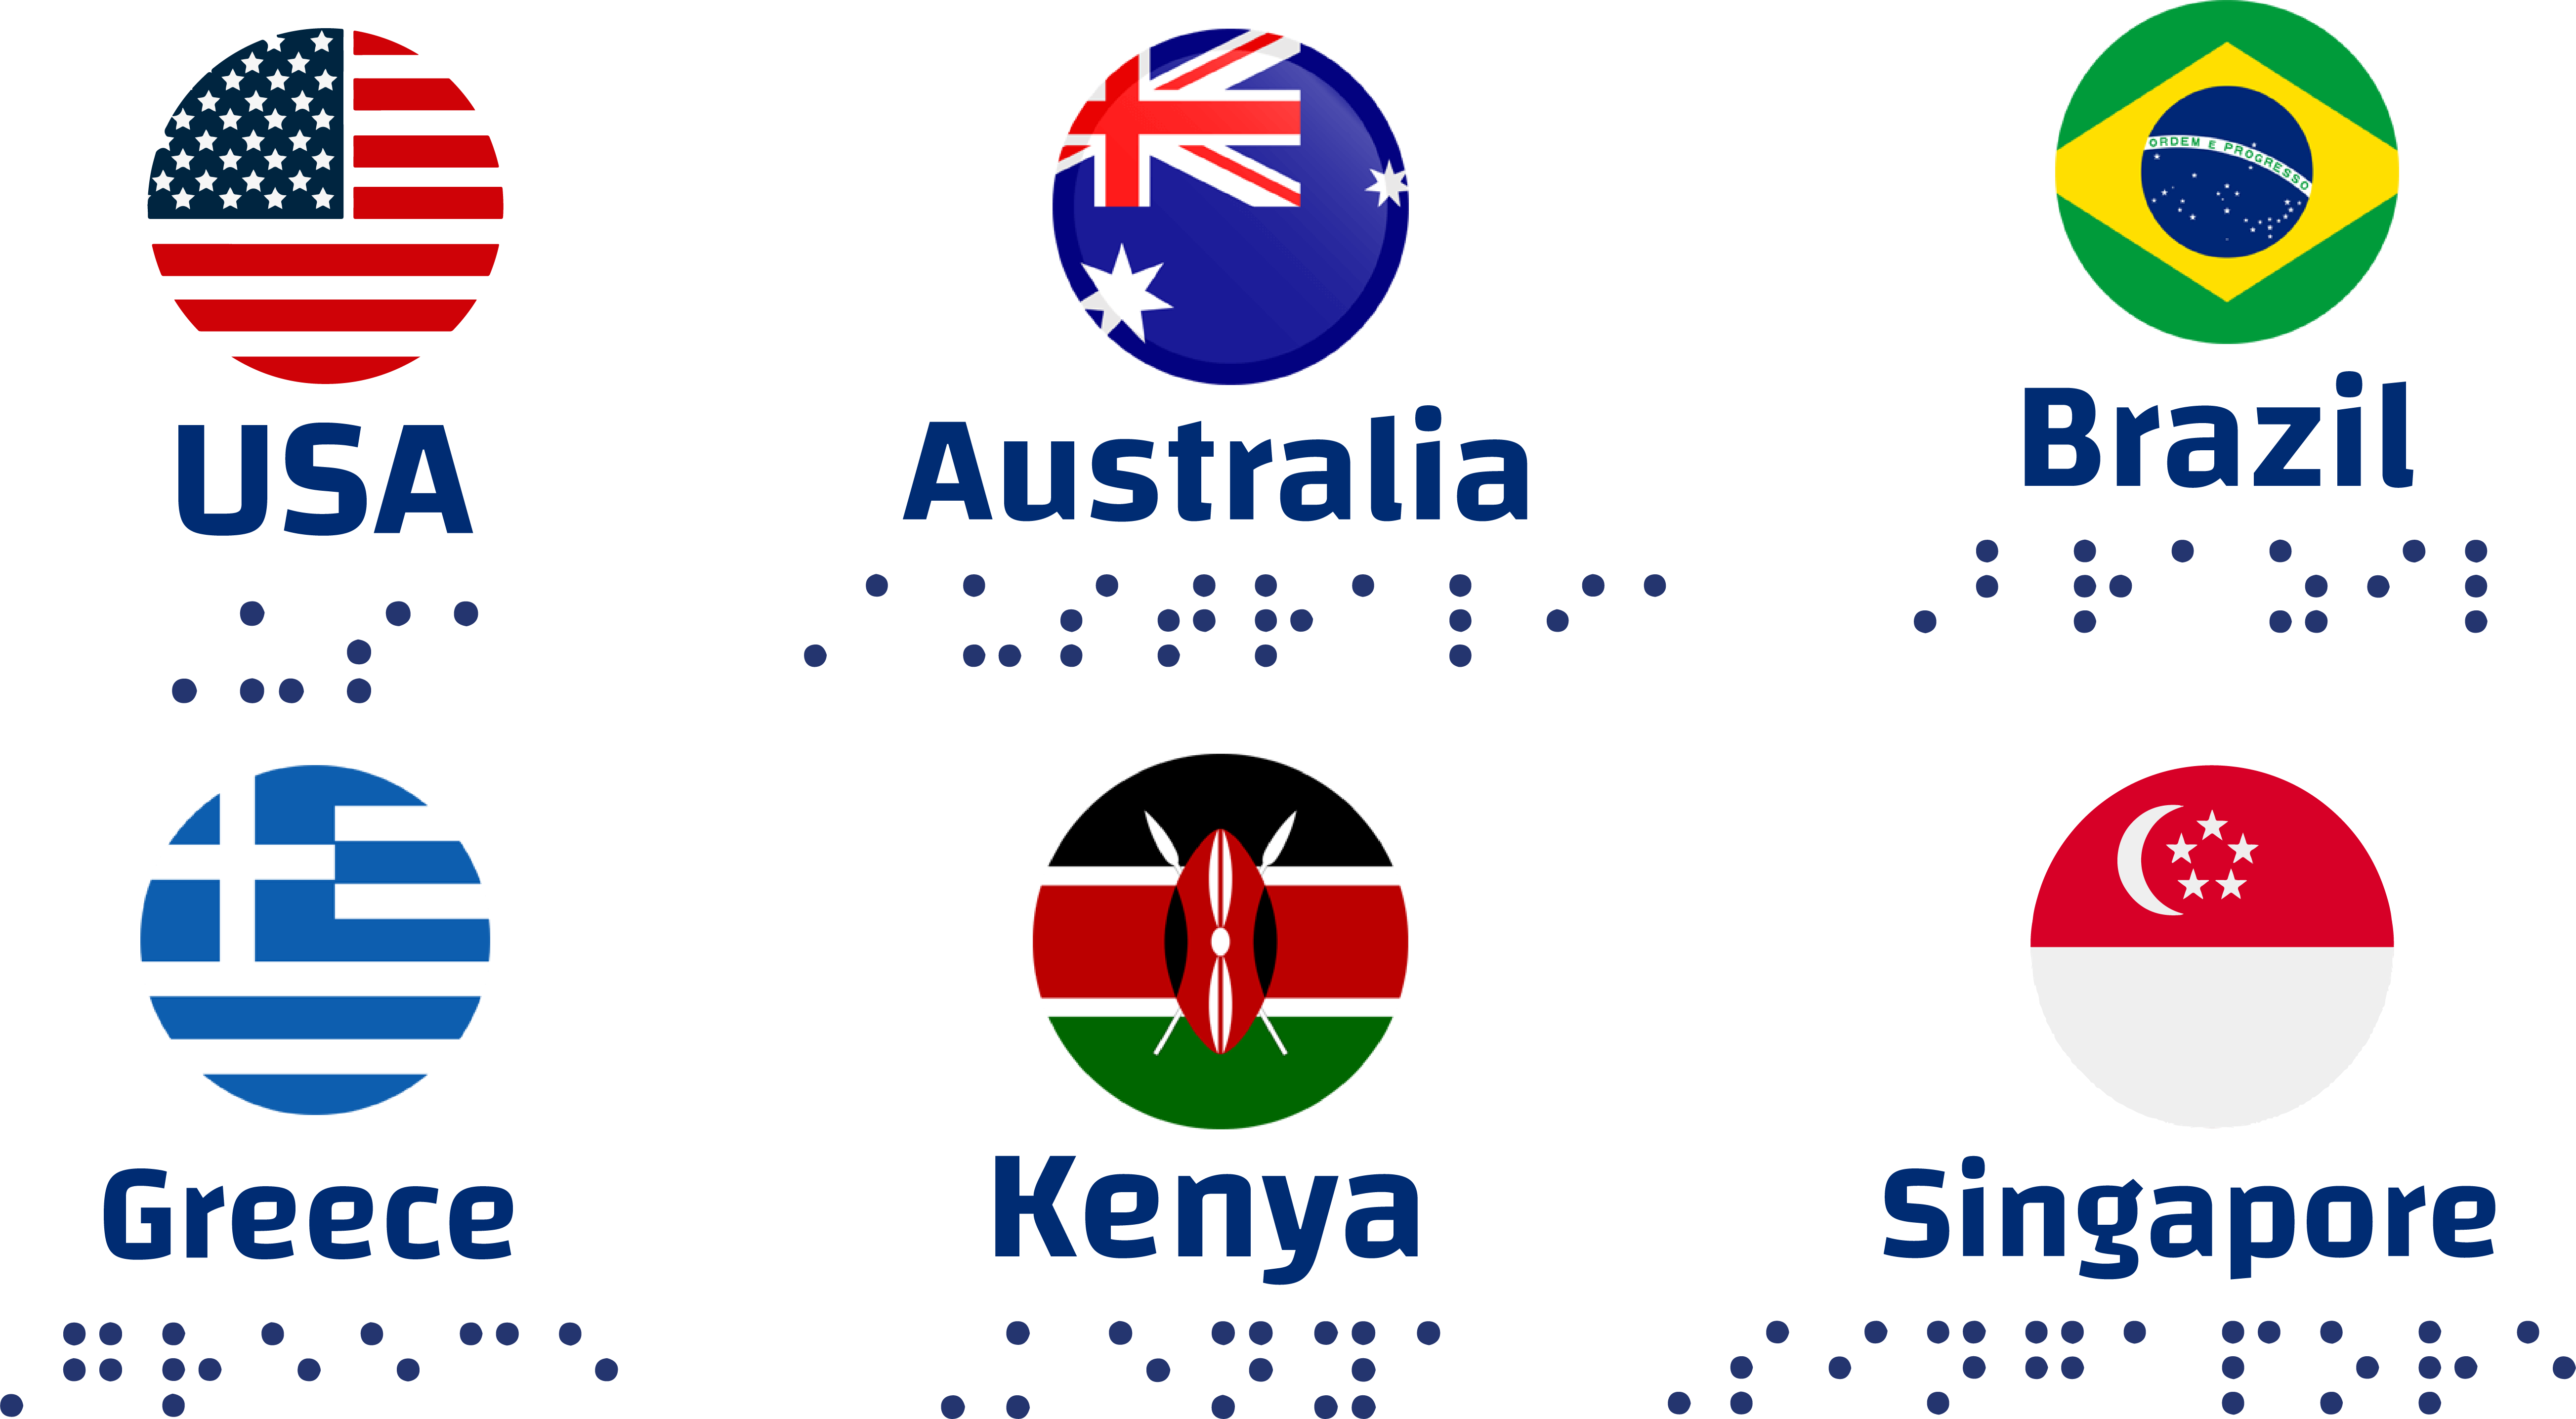
Click here for a pdf of the Country tokens.
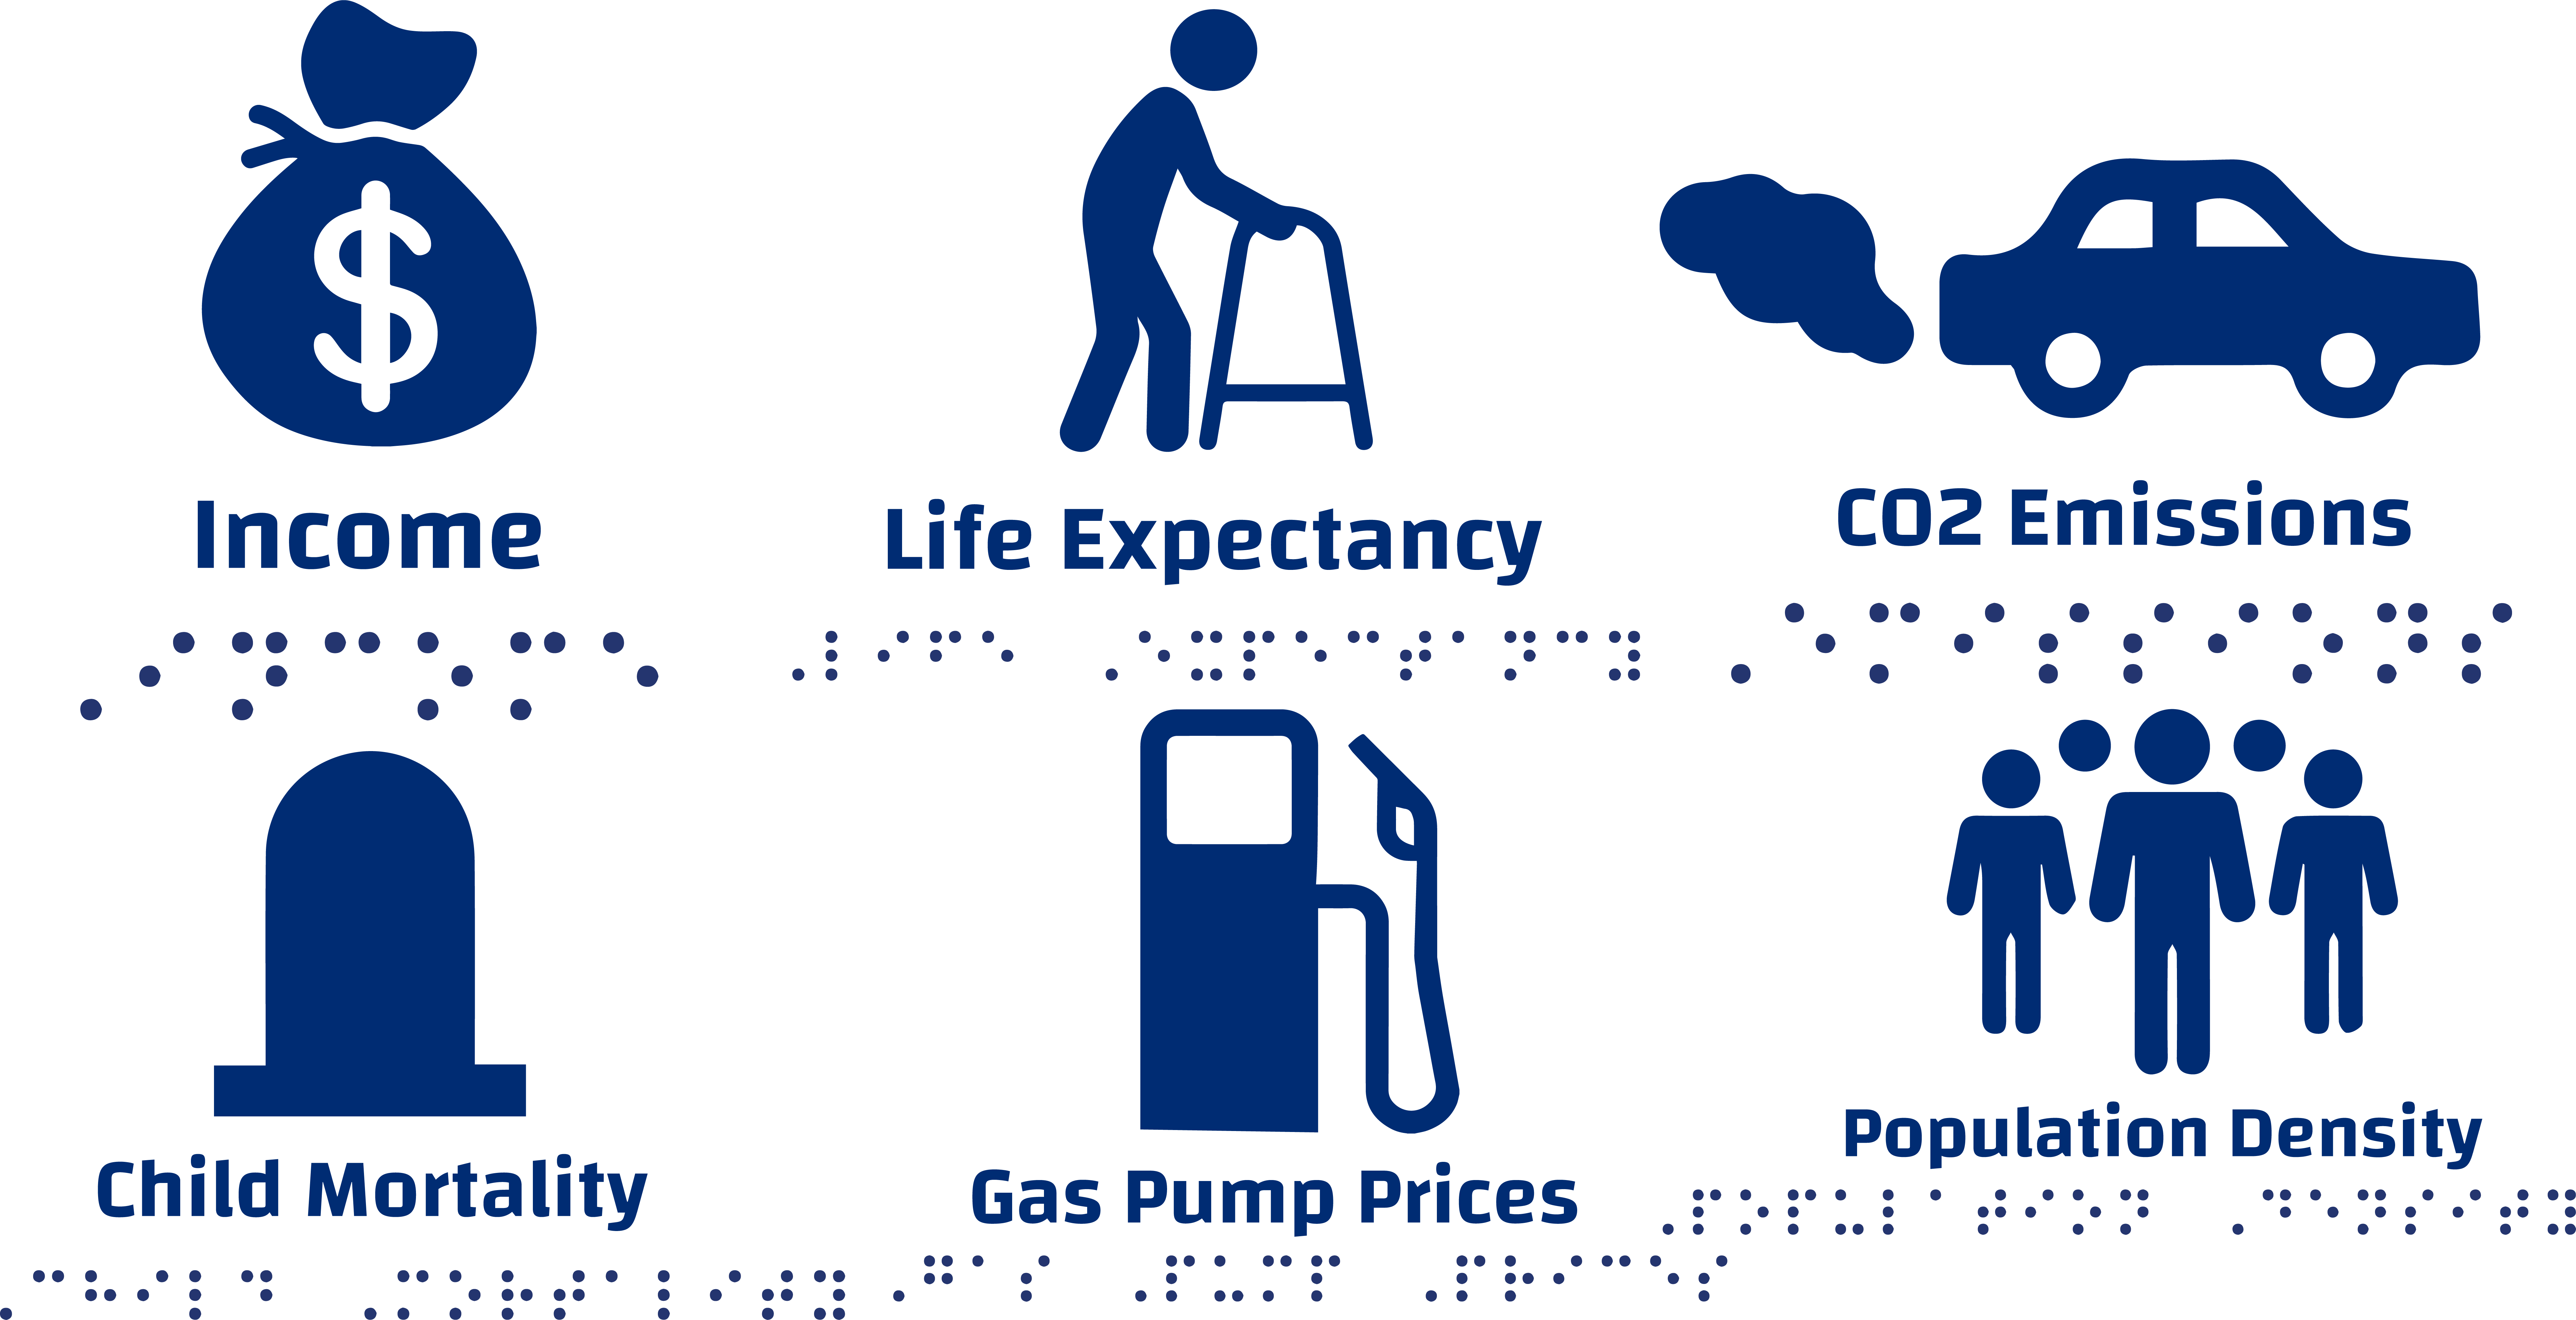
Click here for a pdf of the Indicator tokens.

Click here for a pdf of the X and Y buckets.
If you decide to make your own token objects, you should be mindful to design for the interaction between the indicators and the X and Y buckets. To select an indicator to visualize, the user must place it in close proximity to one of the X or Y buckets. If one indicator is selected for one of the axis, you should be mindful to prevent other indicators from being in proximity to selected axis bucket.
Our 3-d models
All tokens have the labels embossed on the top and the fiducials engraved on the bottom. The country tokens are simple cylinders and the indicator tokens are conical.

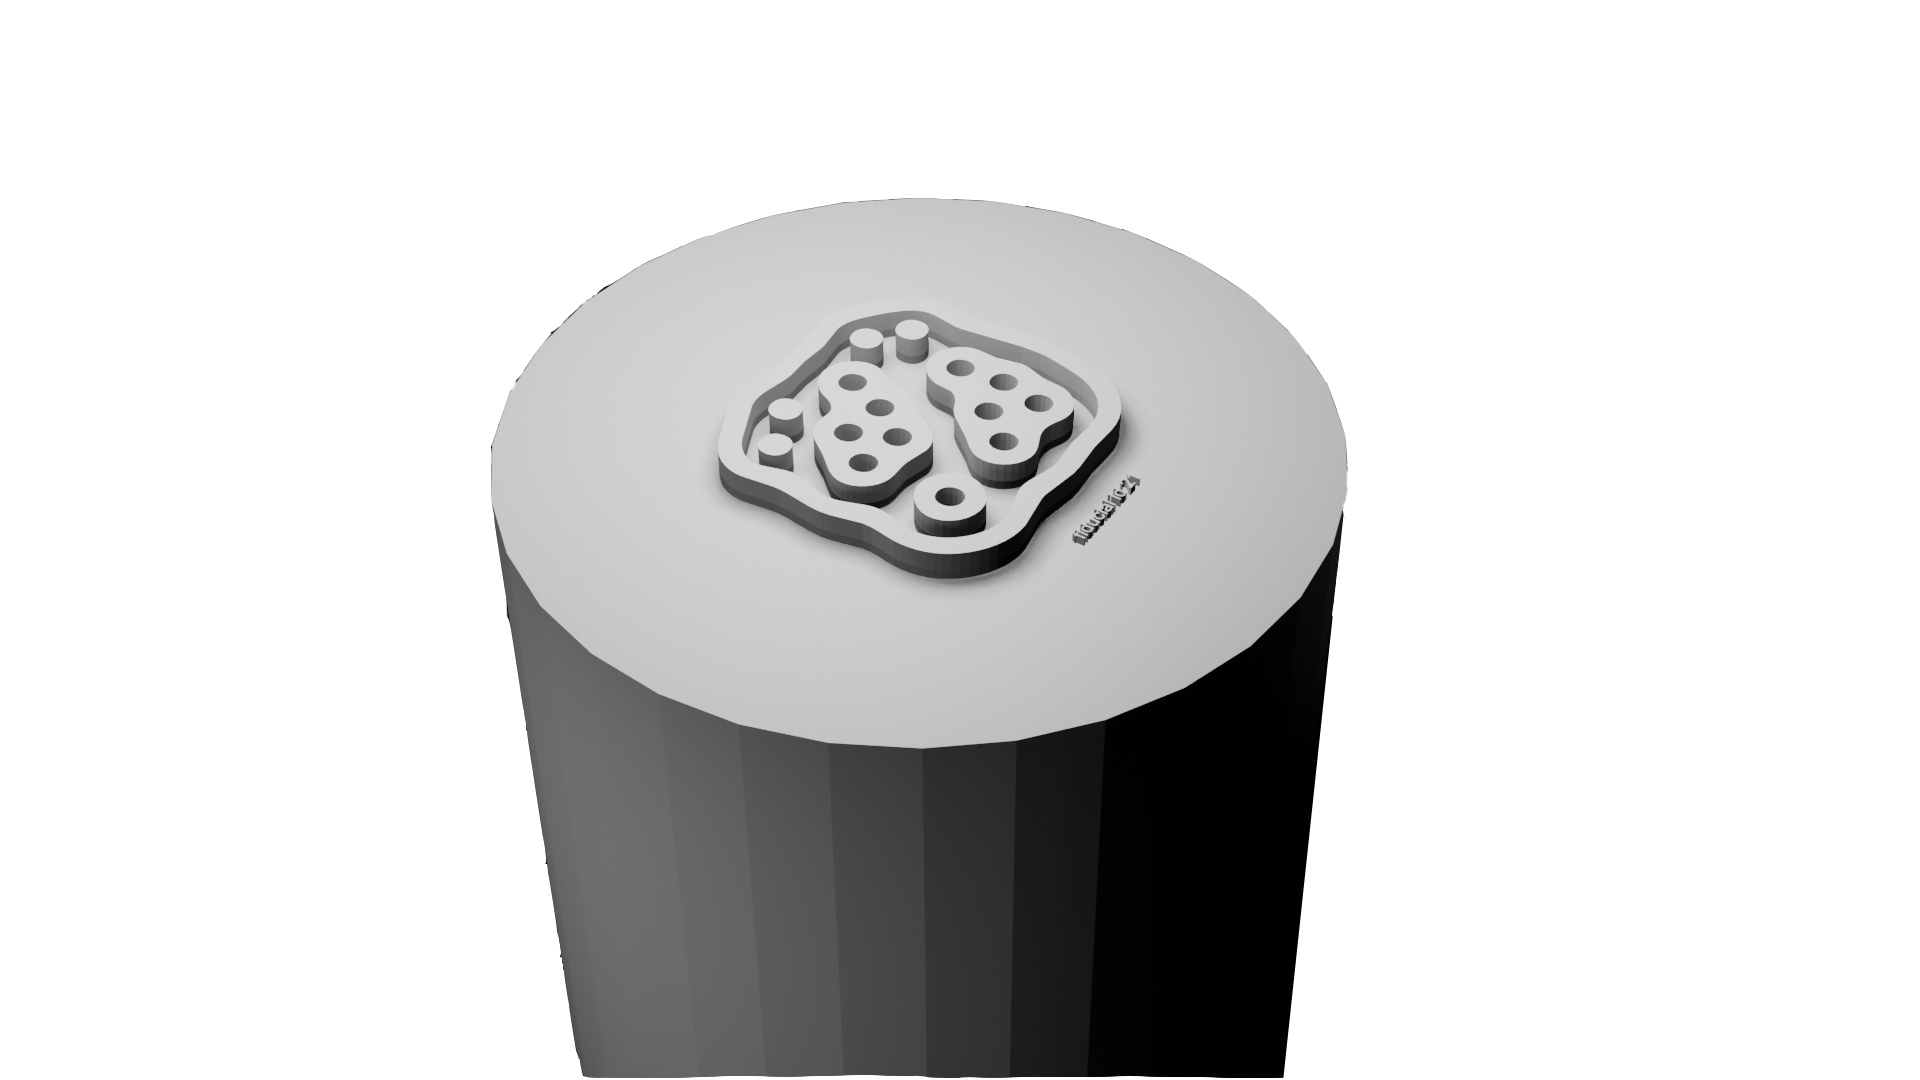
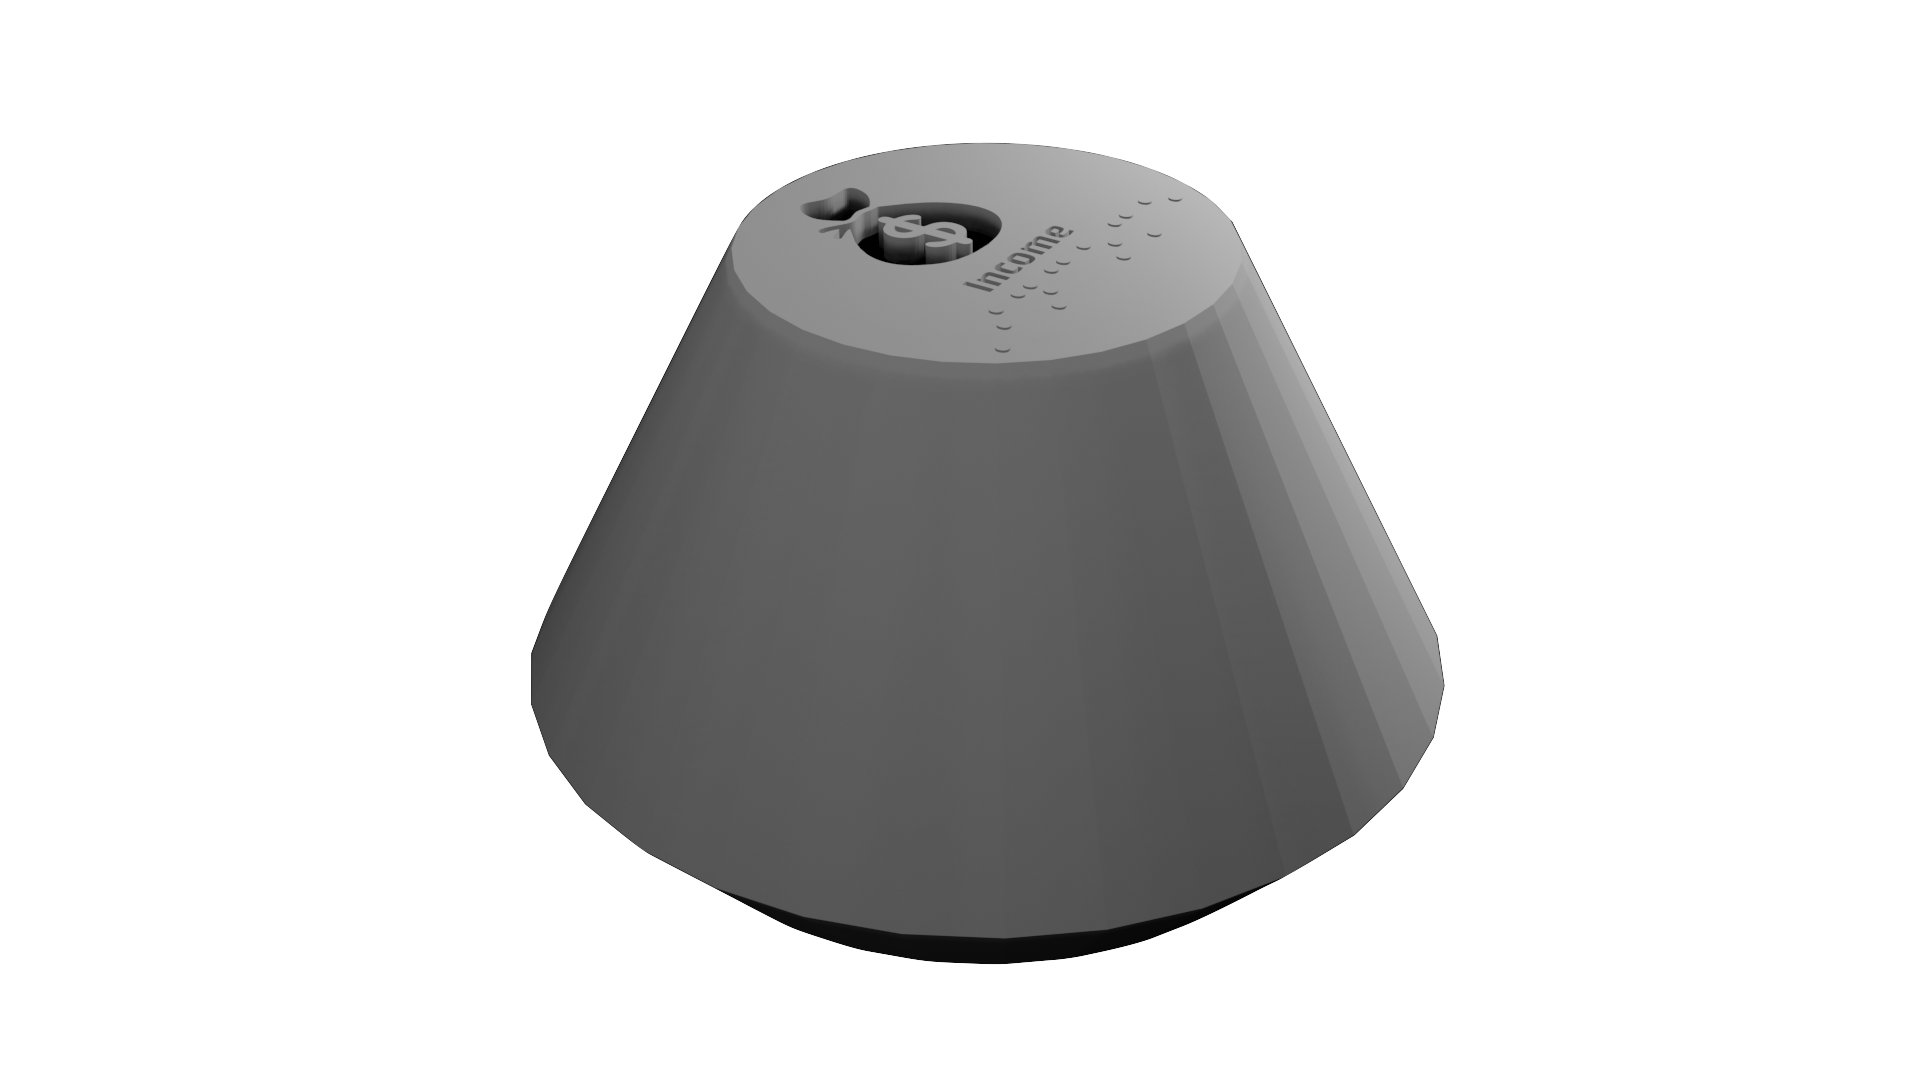
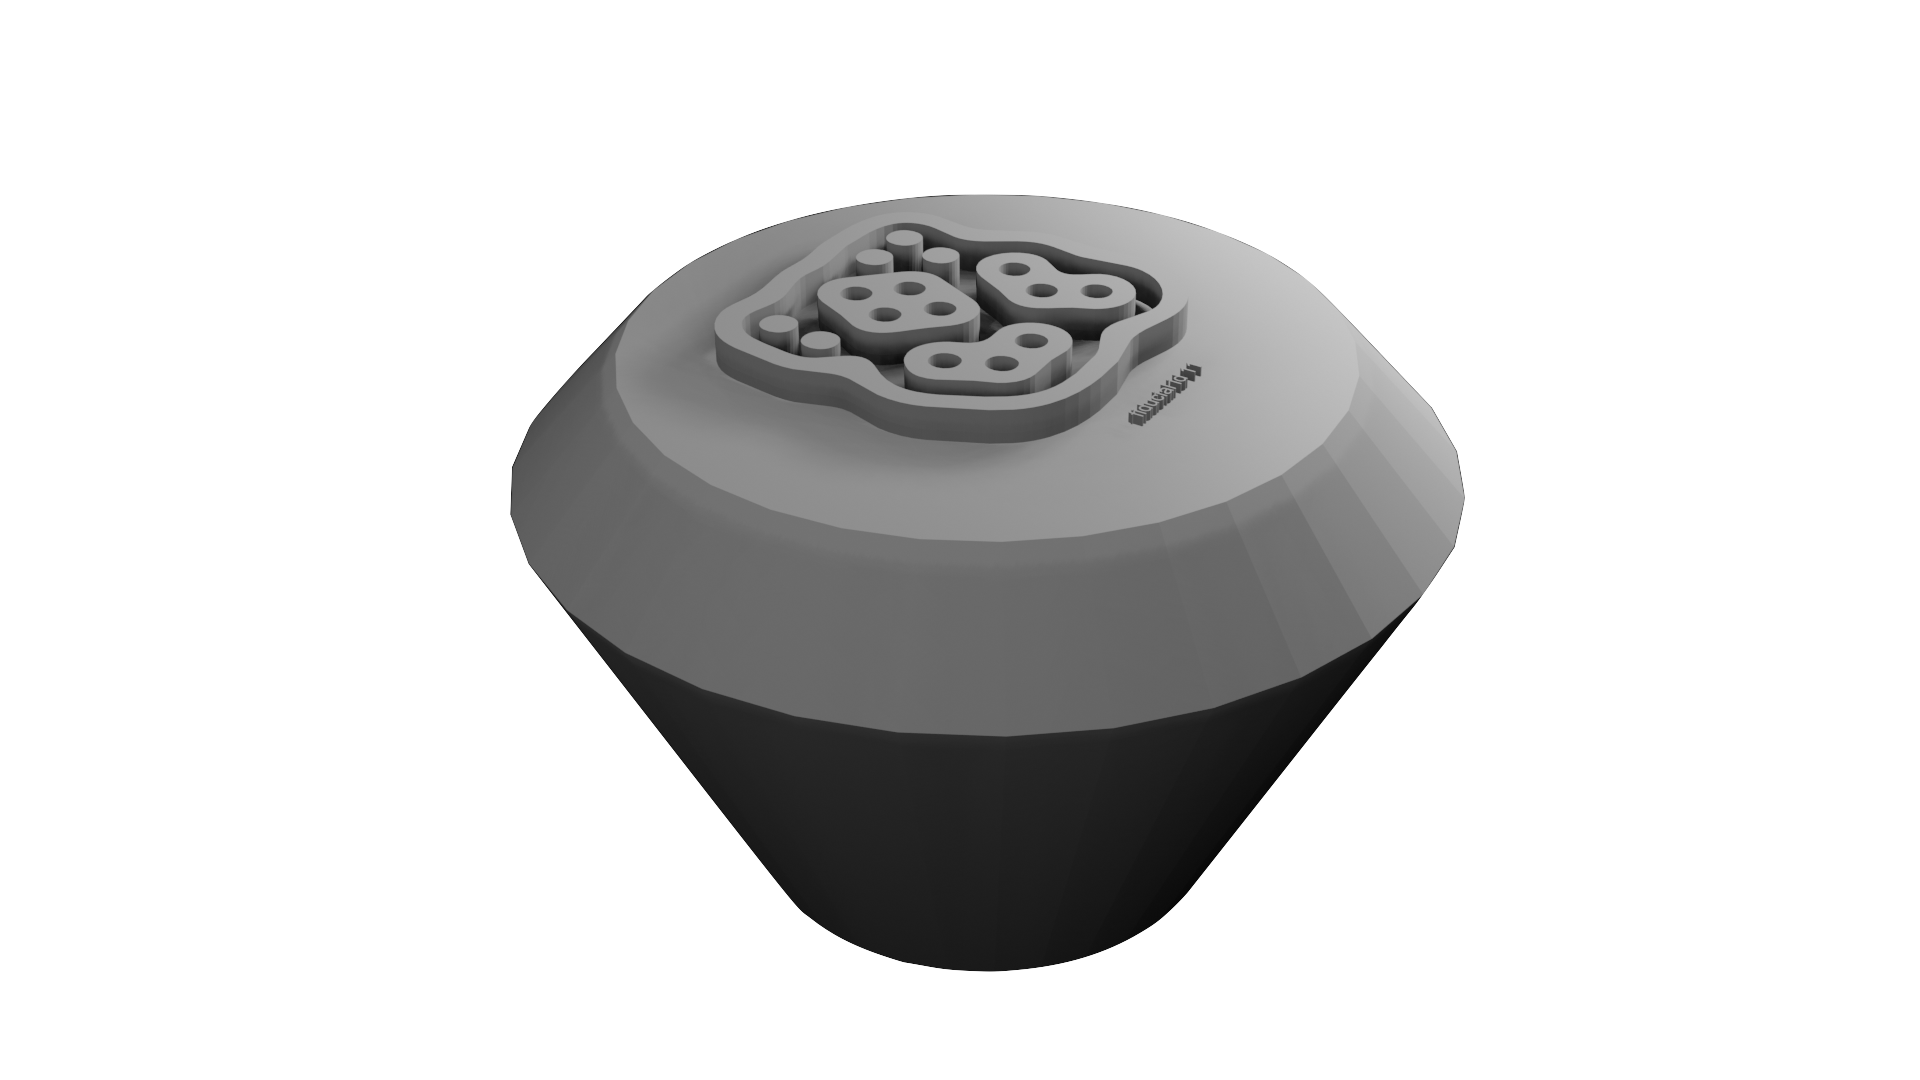
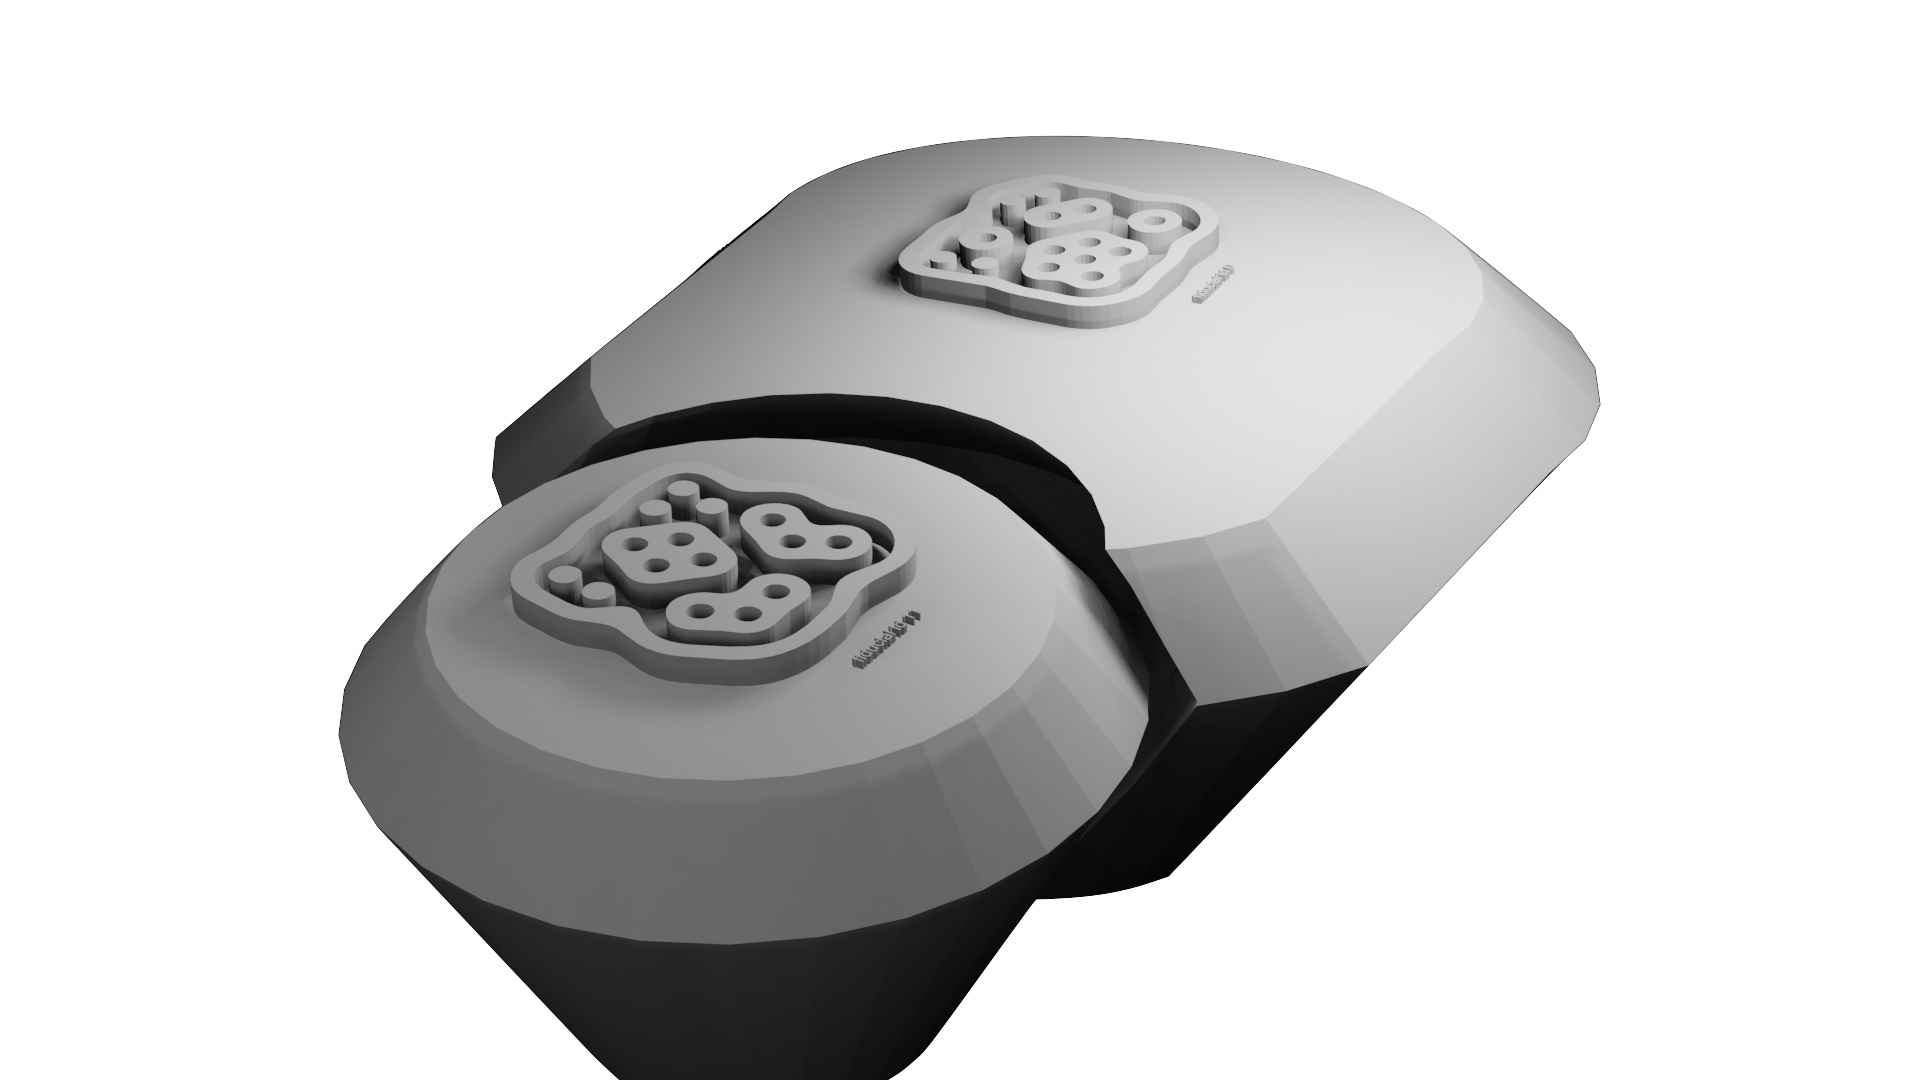
We designed tokens for the indicators and the X and Y buckets so that they intuitively fit together, as illustrated below.

The stl files for all our tokens can be downloaded from a single zip file here.